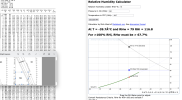
I have been working with becoming adept with your calculator, and am currently checking out sounding data to see how it compares with Appleman charts. I am using the high bypass Appleman chart, and the particular combination shows a firm 'No' at 300 mb even if the humidity is >100%. And then I use your calculator and get a borderline 'Yes' for persistent contrails.
Am wondering why there is such a disparity in results. I have been relying on Appleman for quite some time, but am thinking your calculator refines it. But this is throwing me for a loop.
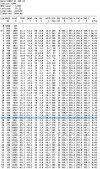
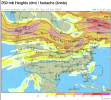
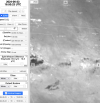
Am inlcuding satellite photos in 2 views, COD radiosonde data, and Windy temp and dew point traces. No contrails evident, but this would be mainly to the very 'dirty' airmass full of cirriform clouds at and to the west of Amarillo. The contrails would undoubtedly be just 'absorbed' into the very deep moist layer and been unseen from below or above.
Gave another view a shot, using Mid Level Tropospheric Water Vapor, and I do see a contrail north of Lubbock extending to the southeast, a bit later at 1550UTC. This appears to be resolving towards your calculator result and Applemann not panning out.
I'd appreciate any thoughts.


Am wondering why there is such a disparity in results. I have been relying on Appleman for quite some time, but am thinking your calculator refines it. But this is throwing me for a loop.
Am inlcuding satellite photos in 2 views, COD radiosonde data, and Windy temp and dew point traces. No contrails evident, but this would be mainly to the very 'dirty' airmass full of cirriform clouds at and to the west of Amarillo. The contrails would undoubtedly be just 'absorbed' into the very deep moist layer and been unseen from below or above.
Gave another view a shot, using Mid Level Tropospheric Water Vapor, and I do see a contrail north of Lubbock extending to the southeast, a bit later at 1550UTC. This appears to be resolving towards your calculator result and Applemann not panning out.
I'd appreciate any thoughts.
Last edited by a moderator: